If you’re still relying on text-heavy content while your competitors gain 94% more views with visual strategies, you’re missing a crucial engagement opportunity. There’s one type of visual content that reaches 54% more readers than traditional blog posts—and it might transform your results.
Key Takeaways:
Content marketing continues evolving at lightning speed, yet many businesses still rely heavily on text-based approaches while missing out on one of the most effective engagement tools available. Visual content has transformed how audiences consume information, creating new opportunities for brands to connect with their target markets in meaningful ways.
The statistics paint a clear picture: content incorporating visual elements dramatically outperforms text-only alternatives. Research consistently demonstrates that posts featuring relevant images generate 94% more views than their plain-text counterparts. This isn't just a minor improvement – it represents a fundamental shift in how audiences interact with digital content.
Visual content creates immediate impact by breaking through the noise of crowded feeds and overloaded inboxes. While readers might scroll past lengthy paragraphs, compelling visuals stop them mid-scroll and encourage deeper engagement. The effect extends beyond simple view counts, as visual content also increases time spent on pages and reduces bounce rates.
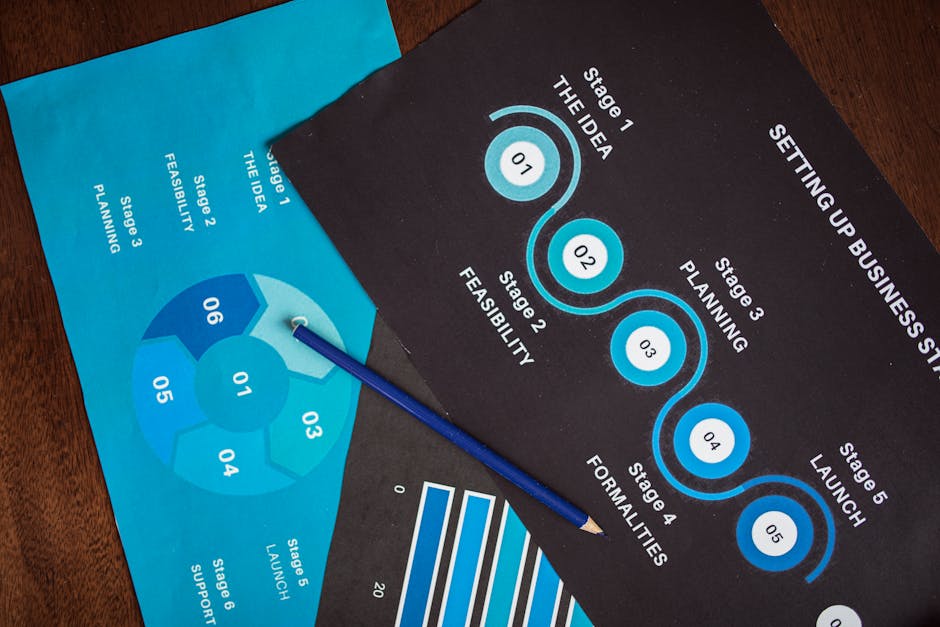
Modern consumers face information overload daily, making visual hierarchy and digestible formatting vital for successful content strategy, but can significantly amplify these engagement benefits while also strengthening brand image.
The science behind visual processing reveals why infographics excel at communication. Research suggests that the human brain processes visual information significantly faster than text, with some studies indicating a speed advantage of 6x to 600x or more. While the often-cited figure of 60,000 times faster is an oversimplification, the speed advantage of visuals remains substantial.
This biological preference for visual information stems from evolutionary development, where quick visual recognition often meant survival. Today's digital environment mirrors this urgency, with audiences scanning content rapidly to determine relevance and value. Infographics take advantage of this natural processing advantage by presenting information in formats the brain readily accepts and understands.
Social media algorithms consistently favor content that generates engagement, making shareability a critical factor for organic reach. Infographics achieve exceptional sharing rates because they combine visual appeal with informational value, creating content users feel proud to share with their networks.
The compact, self-contained nature of infographics makes them perfect for social media platforms where space and attention are limited. Unlike lengthy articles that require significant time investment, infographics deliver complete messages at a glance, encouraging immediate sharing behavior. This viral potential can exponentially expand brand reach without additional advertising spend.
Comparative research demonstrates infographics' superior reach potential, with a 2016 study showing they connect with 54% more readers than traditional blog posts. This increased reach occurs across multiple channels, from social media platforms to search engine results and email marketing campaigns.
The broader reach stems from infographics' versatility and cross-platform compatibility. A single well-designed infographic can perform effectively on Pinterest, LinkedIn, Twitter, and embedded within blog posts, multiplying exposure opportunities. This multi-channel effectiveness provides exceptional return on content creation investment.
Complex information often creates barriers between businesses and their audiences, particularly when dealing with technical products, industry statistics, or detailed processes. Infographics excel at dismantling these barriers by transforming intimidating data sets into accessible visual narratives that anyone can understand.
The key lies in information hierarchy and progressive revelation. Effective infographics guide readers through logical sequences, introducing concepts step-by-step rather than overwhelming them with detailed information upfront. This approach builds understanding gradually, ensuring audiences remain engaged throughout the entire message.
Well-designed data visualizations boost perceived credibility by demonstrating transparency and research-backed insights. When businesses present statistics, trends, or comparative information through professional infographics, audiences view them as more authoritative and trustworthy than unsupported claims.
Credibility increases further when infographics include proper source attribution and methodology explanations. This transparency signals professionalism while providing audiences with verification paths for the information presented. The visual format also makes it easier for readers to spot inconsistencies or questionable data, encouraging creators to maintain high accuracy standards.
Thought leadership develops through consistent, valuable content distribution across relevant industry channels. Infographics support this goal by packaging expertise into shareable formats that demonstrate deep subject matter knowledge while remaining accessible to broader audiences.
When the same organization consistently produces high-quality visual content across multiple platforms, audiences begin recognizing their expertise and turning to them for industry insights. This recognition translates into increased website traffic, speaking opportunities, partnership inquiries, and customer trust.
Effective infographic distribution requires matching content themes with appropriate platform audiences. LinkedIn excels for B2B infographics focusing on industry trends and professional development, while Pinterest performs better for lifestyle, how-to, and consumer-focused visual content.
Targeted distribution ensures infographics reach audiences most likely to engage meaningfully with the content and take desired actions. This focused approach generates higher-quality traffic than broad distribution strategies, leading to better conversion rates and more valuable audience relationships.
High-authority platforms with domain authority scores above 50 provide exceptional value for infographic distribution. Pinterest leads with a domain authority of 94 (according to Moz), offering massive reach potential and long-term content visibility. SlideShare, Behance, and Reddit's infographic communities also provide substantial exposure opportunities.
Each platform requires specific optimization strategies to maximize performance. Pinterest benefits from vertical infographic formats and keyword-rich descriptions, while SlideShare performs better with presentation-style layouts that break complex infographics into digestible sections. Understanding these nuances ensures optimal results from distribution efforts.
Many content strategies overlook infographics despite their proven effectiveness, creating significant missed opportunities for engagement and growth. This oversight often stems from perceived complexity or resource requirements, yet modern tools and platforms have simplified infographic creation considerably.
The integration challenge involves identifying existing content that could benefit from visual improvement, then systematically developing infographics that complement and amplify written materials. This approach maximizes content value while building a visual library that supports multiple marketing objectives.
Successful infographic strategies combine compelling design with strategic distribution, ensuring visual content reaches appropriate audiences through channels that maximize engagement and conversion potential. The compound effect of consistent visual content creation and distribution establishes brands as authoritative industry voices while driving measurable business results.
AmpiFire helps businesses create and distribute high-impact infographics across 300+ platforms to maximize reach and engagement.